![The Importance of Gantt Chart and Critical Path for Project Planning | InLoox]()
For businesses in general and project managers in particular the Gantt Chart and the Critical Path are vital tools that can make or break a project and business undertaking. This might sound exaggerated, but while they are not a magic cure-all, they can assist in keeping a project on the right track.
Gantt Chart
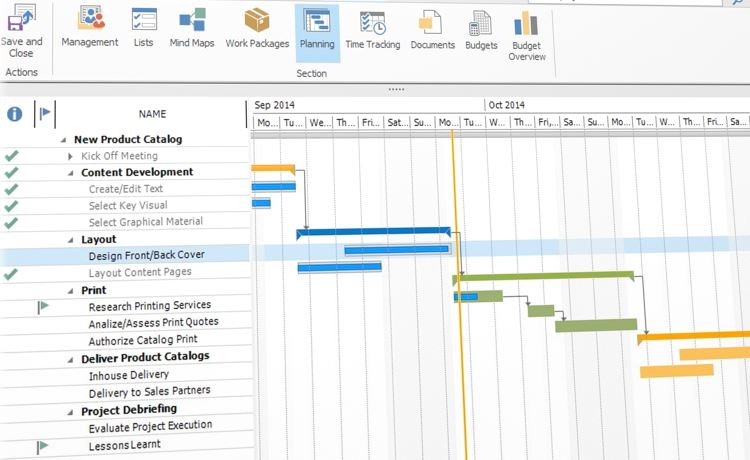
Gantt charts are an easy way to schedule tasks and track the progress of your project against your deadline, in short it is a project planning tool that shows the beginning and finish dates of individual tasks through horizontal bar graphs. A simple Gantt chart can be done using a spreadsheet, but for rather complex projects with many tasks it is better to use a project management software.
Before you create a chart it is important to list all the activities of your project including how long it might take to finish them. It is possible that some tasks might overlap, while others will run one after the other. To keep things clear, you should list the activities in a table. This first step is very important, because it sounds easier than it is to break the project’s activities down in advance, but it will help you to really concentrate on the important tasks at hand.
After that you can start creating a Gantt chart. It always consists of a horizontal axis that illustrates the time span of your project (divided in days, weeks or months) and a vertical axis that shows a list of all the individual tasks. Colors can be used to show the progress of the task (to-do, in progress, finished).
The advantages of using a Gantt chart is that it helps you monitor the progress of your project and to set priorities. The project manager and the team members can easily see what needs to be done at what time and if there are any delays the chart can easily be altered to balance it. This is important to remember, a Gantt chart is not carved in stone. Having a perfect chart does not guarantee a successful project execution on deadline, it is also crucial to compare the projected progress to the real progress and then update the chart accordingly.
Critical Path
The disadvantage of the Gantt chart is that it does not show the dependency of tasks to each other and it does not show which tasks are ‘critical’ to finishing the project on time. This is where the Critical Path Method (CPM) comes in. A critical path is a sequence of tasks that must be finished before the project can be finished and in some cases a task must be finished before the next dependent one can start, so if a task cannot be finished on time, then the whole project will take longer to the same extent.
It is important to mention the bottleneck in combination with the critical path. During the process of a project you will encounter obstacles that will hinder you from finishing the project on time. While the critical path can’t prevent those, it will help you recognizing them and taking the right measures at the right time so that it will prevent your project from getting delayed.
Like with the Gantt chart, the first step in creating a critical path diagram is to list all the activities of your project in a table. The second step is to illustrate your tasks with a circle and arrow diagram (the circles are also called ‘nodes’). Each circle is labelled with a number starting with ‘1’. The arrow between the two activity nodes represents the activity that needs to be done in order to finish the task.
Simple Critical Path Diagram
Afterwards it’s possible to use a spreadsheet to illustrate your critical path in a Gantt chart.
Conclusion
This is, of course, a very simple overview on how to create and use a Gantt chart and the Critical Path method to plan and monitor the progress of your projects. They are not automatically a guarantee for a successful conclusion of a project, but they are vital tools that can help the project manager and the members of a team keep on the right course.

